How it Works
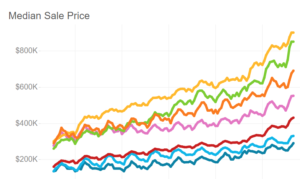
Select the tab for the type of data that you’re looking for. Under each tab, you can filter results by metropolitan area, property type, month-over-month change, year-over-year change, and the time period. Each visualization will change with your selections.
After making your selections, click on the visualization and then hit the download button on the bottom right corner to get the data shown.
Alternatively, you can select the “Download” tab and download all of the data that we have available.